The End User web application informs employees and gives them a conscious awareness of the costs related to their mobile, fixed phone, and IT usage.
The solution provides various indicators classified between plans and usages for users to better manage their own costs.
A mobile version of this application is available here:
For administrators follow this url on how to enroll users :
The application consists of the following parts:
A welcome page that shows the total amount of all a user's costs and its trend (variation) from the previous month's costs.
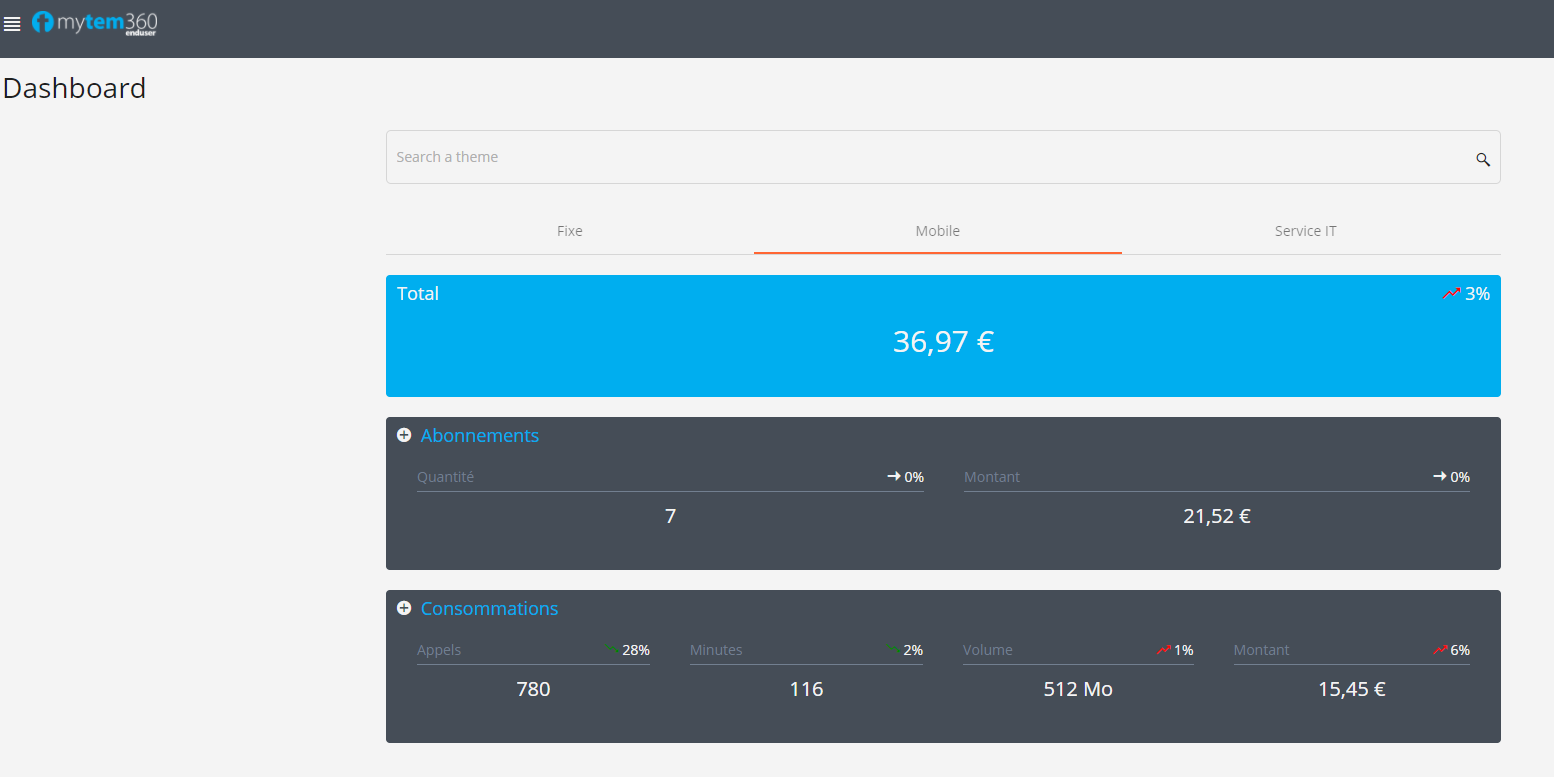
A dynamic dashboard that allows you to analyze costs according to different segments (fixed, mobile, data or IT) and provides details on the different products groups from a macro to a micro perspective.
A detailed information sheet centralizing all the information for a single user:
- The client organization and the location assigned to her
- Details of the device(s) assigned to her
- Items from her mobile line, provider, account, sub-account, SIM, and PUK.
This documentation presents the following items:
1- How to connect to the web app
2- The welcome page with widgets and KPIs
3- The App menu
4- The Dashboard
5- My information sheets
1- How to connect to the web application
Access the app in https://saaswedo.mytem360.com/enduser/login
Connect to the mytem Enduser app with your login (email address) and the password that you have defined in the activation link that has been sent to you.

2- Welcome page
You will land on the Widget page called "Total monthly costs" and the KPI "3-month cost evolution by segment".

The icon  lets you customize the segment (Fixe, Mobile, Services IT) or even the chart type (diagram, bar chart, line chart):


3- App menu
Access the app menu by clicking on ![]() located in the upper left corner:
located in the upper left corner:


From this menu, you can:
- Choose a line you would like to observe (if you have several lines enrolled in the app).

- Choose the period you would like to observe:

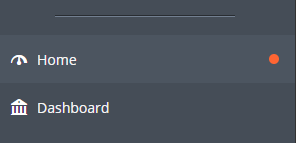
- Access the Welcome page or the dashboard:

(the icon  indicates in which module you are currently in)
- Log out of the app:

4- Dashboard
Access the dashboard from the app as shown here:

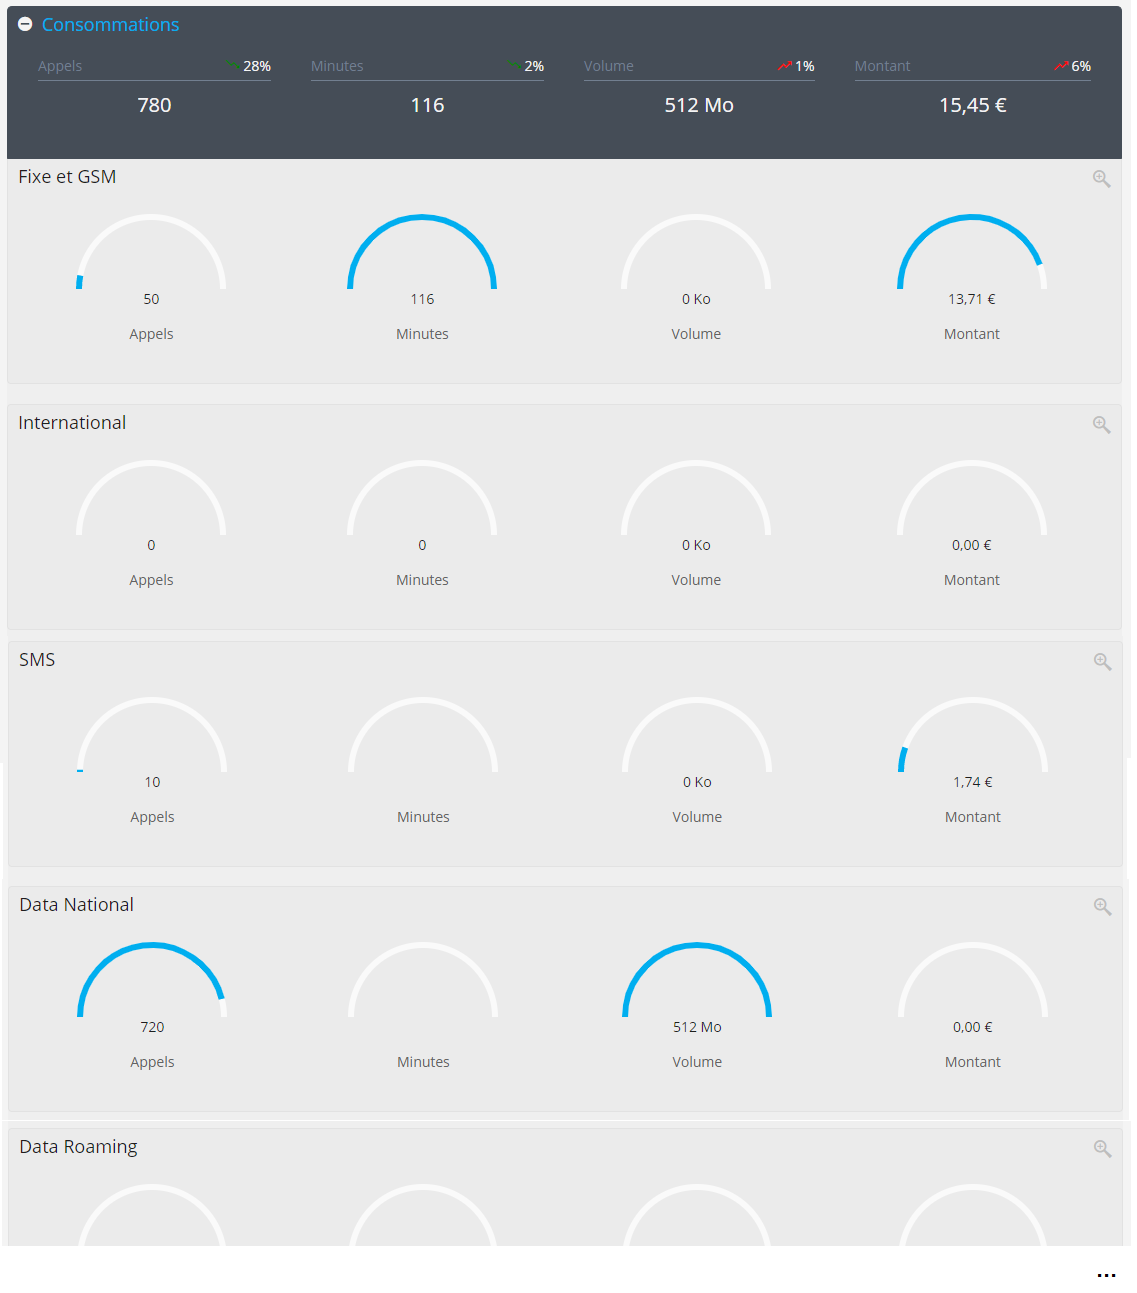
By clicking on the different product groups, you will see more details of their cost breakdown:


(clicking for example on the product group Domestic data)

The dashboard also provides:
- the possibility to filter data by segment (fixed, mobile, IT or data services):

- the total costs invoiced for your line on a given period:

- plan-related costs, with the number of products invoiced:

- usage-related costs with the number of calls and their duration, as well as the volume of data used:

- for each data shown, a comparison by percentage appears in relation to the previous month's data, as well as an arrow showing whether the trend goes upward or downward:

- the search feature, which shows directly the costs related to a certain product group:

5- Detailed information sheets
You can find detailed information:
- User (first name, last name, user ID, position, date of entry, location...)
- Device (model, IMEI, serial number ...)
- Line (provider, billing account, sub account ...)
- SIM (SIM number, PUK1 code ...)
by clicking on the bar on this part of the app:
then clicking on ![]() in the upper right part of the app:
in the upper right part of the app:


xyz5678Ttranslatedfrompage
Comments
0 comments
Article is closed for comments.